Introduction to Data Reuse, Access and Provenance
Overview
Teaching: 5 min
Exercises: 0 minQuestions
What will be covered in this section
Objectives
Practice best practices for manipulating and analyzing data. Learn what to look for in metadata to make sure a dataset is ready for analysis.
What we will cover in Part II:
- How to assess a dataset to make sure it is ready for analysis.
- Access and download a dataset from BCO-DMO.
- Learn the benefits and drawbacks to analyzing data in spreadsheets.
- Walkthrough data access and plotting to learn about document provenance.
- Learn about other ways to analyze data other than spreadsheets.
Introduction
Spreadsheets are good for data entry, but in reality we tend to use spreadsheet programs for much more than data entry. We use them to create data tables for publications, to generate summary statistics, and make figures.
Why is data analysis in spreadsheets challenging?
-
Data analysis in spreadsheets usually requires a lot of manual work. If you want to change a parameter or run an analysis with a new dataset, you usually have to redo everything by hand. (We do know that you can create macros, but see the next point.)
-
It is also difficult to track or reproduce statistical or plotting analyses done in spreadsheet programs when you want to go back to your work or someone asks for details of your analysis. It can be very difficult, if not impossible, to replicate your steps (much less retrace anyone else’s), particularly if your stats or figures require you to do more complex calculation.
-
Generating tables for publications in a spreadsheet is not optimal - often, when formatting a data table for publication, we’re reporting key summary statistics in a way that is not really meant to be read as data, and often involves special formatting (merging cells, creating borders, making it pretty). We advise you to do this sort of operation within your document editing software.
Using Spreadsheets for Data Entry and Cleaning
However, there are circumstances where you might want to use a spreadsheet program to produce “quick and dirty” calculations or figures, and data cleaning will help you use some of these features. Data cleaning also puts your data in a better format prior to importation into a statistical analysis program. We will show you how to use some features of spreadsheet programs to check your data quality along the way and produce preliminary summary statistics.
What this lesson will not teach you
- How to do more advanced statistics in a spreadsheet
- How to write code in spreadsheet programs
If you’re looking to do this, a good reference is Head First Excel, published by O’Reilly.
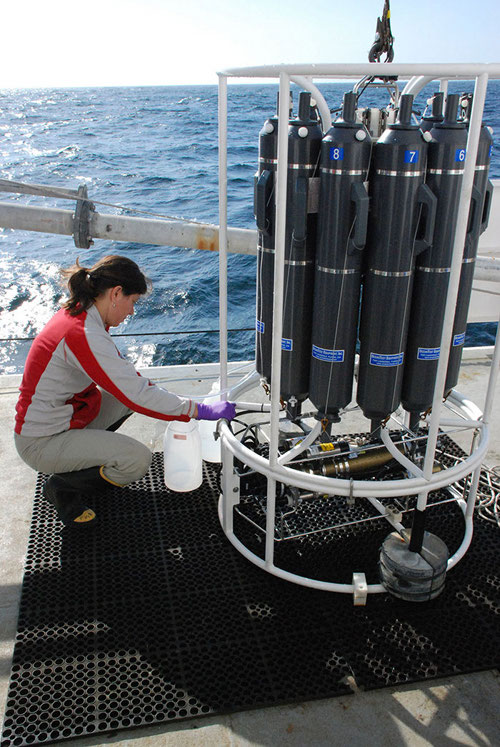
Background: What is a CTD?
CTD stands for conductivity, temperature, and depth, and refers to a package of electronic instruments that measure these properties (see more about CTDs at https://oceanexplorer.noaa.gov/facts/ctd.html

CTDs can be moored and collect data while they are stationary. They can also be lowered and raised in the water column to create profiles of the water column.
Background: What are Niskin Bottles?
A Niskin bottle is a plastic cylinder with stoppers at each end in order to seal the bottle completely. This device is used to take water samples at a desired depth without the danger of mixing with water from other depths. The water collected by Niskin bottles can be used for studying plankton or measuring the physical characteristics of the sea. Niskin bottles are often either set up in a series of individual bottles or they are set up in a carrousel, together with a CTD instrument. (Source Flanders Marine Institute: https://www.vliz.be/en/Niskinbottle)

The data that we will use in the next chapters will be the BATS CTD and Niskin bottle datasets that BCO-DMO is hosting.
Key Points
Data Analyisis in Spreadsheets is Challenging